Web Masters: Data & Customer Choice [A Q&A with Vennli]

Across disciplines, the demand to make data-driven decisions is heating up.
This is especially true in content marketing, where brands must identify trends and reader response or risk wasting resources (time and money).
Vennli, a SaaS solution that analyzes customer choice and competitive advantage, announced the launch of its updated analytics software recently, including a Heat Map, which allows you to track website visitors and view side-by-side comparisons of how granular customer segments perceive a company's competing offerings, so marketers can make informed decisions based on customer preferences and competitive advantage. Website Magazine caught up with Pooya Ghiaseddin, chief product officer at Vennli, to discuss data visualization, the benefits of market research and more.
How can "data visualization" improve decision making for marketers?
 Turning raw data into actionable insights is a huge challenge, and data visualization gives a clear picture of how to reach niche audiences so marketers can make sure their product or service resonates with their target audience.
Data visualization is especially helpful for marketers without extensive background in market research and data analysis. Data visualization can help break down competitive advantage for marketers trying to take in information that might be difficult to interpret, especially when it's taking figures and trying to calculate where to focus business and marketing efforts. Insights are presented clearly so marketers can easily identify market opportunities and determine the most important factors driving their target customers' purchase decisions.
Data visualization can also be a key component for marketers trying to sell decisions up the ladder to the primary stakeholders. It's easier for marketers to sell their point to primary decision-makers if they have a clear depiction of market opportunities with drawn-out comparisons, as opposed to statistics and figures.
How does Vennli evaluate and show "customer choice"?
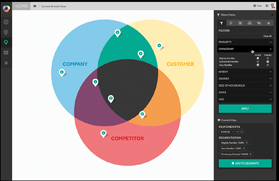
We start by surveying our customer's target audience, and then in our vLens, an interactive, three-circle Venn diagram model, our patent-pending algorithm analyzes and ranks the choice factors that drive purchase decisions. A lot of organizations are surveying their customers, but data that paints a picture of why your target audience is choosing your competitor is a valuable addition to insights from customers who are already choosing you.

In the vLens, our customers have a clear representation of the most important factors driving purchase decisions to a variety of audience segments. Through in-depth segmentation insights, marketers can see if their product or service needs to be altered to target a specific segment or if they need to tailor messaging for different segments. The Heat Map gives marketers a data-backed visual into how to optimize messaging for different groups of customers.
Why should marketers care about this type of competitive analysis?
Traditionally, marketers and brand managers have to rely on outsourcing for data-backed insights and don't always have easy access to market research. A key benefit we offer as a SaaS solution is speed to insights. Making informed business decisions quickly is more important than ever, and marketers can react more efficiently to their audience if they have accurate, timely data that they can easily understand and communicate throughout their organization.
Understanding how customers perceive you versus competitors can give marketers insight into how to adjust message or product offerings which is key to a successful business.
How can Vennli create customer segments and how can marketers use those customer segments to positive effect?
We start by asking high-level demographics questions, but what we're doing differently is getting really specific with questions around a purchase occasion or a buyer persona.
With our newest data visualization feature, the Heat Map, marketers or brand managers can look at audience segments and stack them up against each other to assess factors that might be commonalities or outliers.
Built into our platform, we've written a patent-pending algorithm that takes all of the choice data that we're collecting, analyzes it, and then decide how to spatially represent that in our interactive visualization. It also decides how to bucket the choices based on importance level to the customer. From there, you can identify your competitive advantages, unmet and met needs of your customers, where your competition is winning, points of parity and areas where your organization is winning.
Tell us about a customer who used Vennli to improve their customers' user experience?
We recently helped a for-profit university admissions department determine how prospective students make choices and how they choose between competing programs.
In order to differentiate from other programs, this for-profit university needed to understand how different segments of students make decisions. According to our findings, regional and national accreditation and affordable programs with financial aid available were important factors to students across the board.
In terms of student experience, candidates placed the highest importance on gaining job-related experience, easy access to faculty with personalized attention and existence of cutting-edge learning opportunities.
Before working with Vennli, this for-profit university assumed differences between programs were clear cut and well known by prospective students, but students perceived very few differences between programs. This presented a large opportunity for the university to differentiate.
We also found important differences between segments of applicants. For example, students between the ages of 18 and 24 placed a higher importance on having easy access to faculty for personalized attention.
The insights we delivered enabled the university to take immediate action and develop targeted messaging based on important factors to each segment of applicants. As a result, the university saw a 175 percent increase in enrollment in just a few months.

Subscribe to Our Newsletter!
Latest in Software


![Web Masters: Data & Customer Choice [A Q&A with Vennli]](https://www.websitemagazine.com/hubfs/Imported_Blog_Media/vennlie_100x100-2-1-1-1.png)

