54% of Cloud Providers Are Down for up to 10 Hours a Year

Software as a service (SaaS) organizations and their DevOps teams juggle competing priorities. Among these are launching a killer app, shortening the development cycle, reliability, performance and security.
The gap between a successful launch and sustaining a robust sales cycle is narrow and often contingent on many variables in a fast paced and competitive tech industry.
To get a clear picture of how SaaS groups address the challenges they face on a daily basis, Incapsula recently partnered with Pagerduty and DevOps.com to sponsor a survey of 398 industry vets mainly responsible for DevOps, IT, product development, network operations and engineering. A variety of industries were represented in the survey, including technology, ecommerce, health, education, manufacturing, telecommunications, and financial and insurance institutions.
The survey aggregates input from the org chart, including sales, marketing, customer support, finance and other administrative personnel. It even includes responses from business owners, general managers and CEOs. More than 75 percent of respondents had five years of background in the tech industry, and fifty-five percent had over 10 years of experience.
Website Availability and Uptime
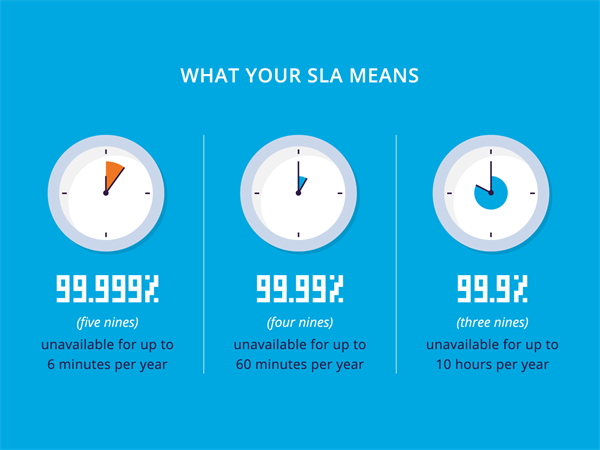
Looking at the big picture, only seven percent of websites offer a service level agreement (SLA) of 100 percent uptime. Forty-six percent of surveyed companies delivered, at best, four nines (99.99 percent) uptime over the past year. This works out to being unavailable for up to one hour a year. Yet the majority of companies surveyed (54 percent) delivered uptime of three nines and less indicating their sites were unavailable for up to 10 hours a year. Consequently, downtime is something you have to be prepared for. 
SaaS experts rely on a number of tools to monitor site availability. There are three tools that are commonly used.
- New Relic (27 percent)
- Pingdom (11 percent)
- Solar Winds (10 percent)
Datadog, LogicMonitor, TrueSight Pulse, Scalyr and Pingometer were other tools mentioned in the survey. A sizeable group of respondents (34 percent) used additional tools, but did not name them specifically.
Communicating Website Status
For some, using status page software can mitigate the anxiety surrounding unavoidable downtime. Twenty-three percent, for example, used their own tools, and nearly 10 percent used Statuspage.io.
We found that 53 percent of companies do not have a status page that shows website availability or downtime. To compensate for the damage, 25 percent of these companies offer some form of credit or refund to customers for the inconvenience. 
Without a status page customers are left to wonder what's going on, often taking the road to social media. This risks your reputation and may cost you in the long run.
Website Monitoring
Here are the four most popular tools for measuring and monitoring website performance from our respondents:
- New Relic (43 percent)
- Pingdom (23 percent)
- Zabbix (19 percent)
- AppDynamics (17 percent)
Studying analytics indicates patterns in user behavior and can offer insights into where the hiccups are on the website. Implementing technology such as content delivery networks (CDNs) and load balancing can offer a smooth user experience. To improve site performance we saw 80 percent of the companies surveyed use load balancing services. Fifty-eight percent use database caching and 55 percent use a CDN.
Spotty availability is the prime reason online customers avoid a site and overall poor site performance is a close second. Sixty-two percent of users will leave a site if a page doesn't complete load in five seconds according to our survey data. This finding is especially relevant for personal and portable devices such as smartphones and tablets.
The Mobile Advantage
Sixty-seven percent of the companies represented in our survey do not have separate performance goals for their mobile platform. This is significant since 31 percent of all website traffic currently comes from mobile devices. Twenty percent of companies have mobile targets, suggesting they see value in maintaining an optimized user experience for mobile users.
Who's Watching Over Security?
Security issues directly impact the user experience, yet many organizational charts never address specifically which in-house team owns the responsibility. The recent National Security Agency malware attack indicates attacks are prevalent and security is everybody's concern.
Our survey shows that organizations that put an emphasis on security generally spread the responsibility equally across CISO (25 percent), DevOps (25 percent) and engineering roles (14 percent).
Not keeping a website safe can be a costly mistake. Forty-nine percent of all DDoS attacks, for example, last between 6-24 hours. It costs roughly $40,000 per hour to mitigate the damage.
Costs aren't limited to the IT group. They also have a large impact on security and risk management, sales and customer sales.
About the Author
Tim Matthews is VP of marketing for Imperva, a leading provider of cyber security solutions that protect business-critical data and applications. Tim splits his time between understanding customer performance and security issues, and building a large-scale SaaS marketing machine.


