On Cohorts & Direct Audience Optimization

Most Website professionals never go beyond unique visits or page views in their discussions of "performance" as their analytics are shallow at best and provide little in the way of actionable insight.
For example, do you know how many users typically return the day after their initial visit or how many visits it takes on average to generate a conversion? Further, do you know how these metrics have changed month over month or year over year and which direction it is trending? The said reality? You probably don't.
In order to find truly detailed information about the performance of a website's experience (as well as the success of marketing campaigns that drive users to the website in the first place) it is often necessary to change how data is being viewed (not just the data that is under review). Web professionals simply need a different vantage point from which analysis can be conducted and one of the best ways to do this, of course, is through what is known as cohort analysis.
A "cohort" is essentially a subset of people/users who are grouped together because of some similarity or shared value. One possible cohort for an ecommerce store might be those that purchased within the last week or month, for example, while a cohort for a software-as-a-service provider looking for new clients might be those that downloaded a specific whitepaper on an industry trend.
A cohort analysis, therefore, is the actual work that is put in to determine if one cohort is more valuable than another. There are near endless possible cohorts that can be used; analysts are really only limited by their creativity.
The reason that cohort analysis is done at all is to provide some insight into how or what is changing at the enterprise and what might be happening in the broader market itself. Change is a constant on the Web, of course, and those responsible for an enterprise's success need to be measuring and analyzing in a way that takes that into account. Cohorts enable analysts to do just that, adding some much needed context to their data. If Web professionals don't act on the insights provided by such analysis, however, it does not provide much benefit over the long term to the brand's bottom line.
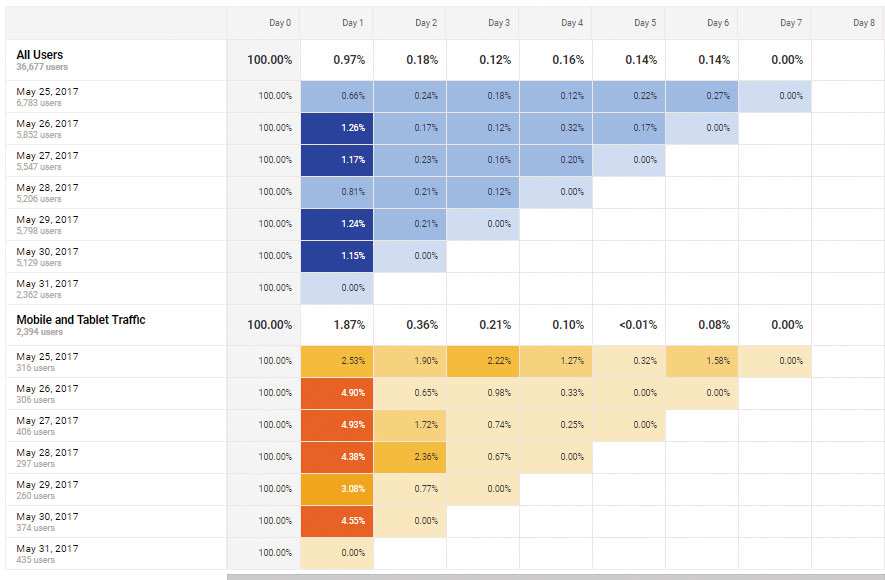
The cohort analysis (chart) below compare two groups - all users to a website and mobile users - and in the context of "user retention" (returning to the website for another visit). What you can tell immediately is that mobile outperforms desktop by a wide margin (mobile has four times the retention as desktop). Noticing this disparity, an analyst might suggest that the website deploy a program where users would be presented with a browser notification in order to increase user retention performance metrics. 
Ultimately, this is really straightforward stuff; analysts just need to dig rather deeply into the data (provided by most top-tier analytics solutions), crafting new views and applying them to various groups, tracking them over time in order to understand how they can help their enterprise move key metrics (see sidebar) in a positive direction.
Cohort analysis enables brands to compare how different groups or subsets of data compare to one another. Since it can be cross referenced based on a number of variables, it's possible to understand what may be influencing success or failure and focus on the most profitable customers, most engaging experiences, and most productive channels. That's reason enough to engage in cohort analysis so get started and share your experience (and the improvements you've made) in the comments section below.
+ PIRATE METRICS: AARRR
Acquisition, activation, retention, referral and revenue - these are the bounty that the endless ocean of the Web can provide. Learn more about pirate metrics.


